Discrete Fourier Transform –
scipy.fftpack
- DFT is a mathematical technique which is used in converting spatial data into frequency data.
- FFT (Fast Fourier Transformation) is an algorithm for computing DFT
- FFT is applied to a multidimensional array.
- Frequency defines the number of signal or wavelength in particular time period.
Example: Take a wave and show using Matplotlib library. we take simple periodic function example of sin(20 × 2πt)
%matplotlib inline
from matplotlib import pyplot as plt
import numpy as np

#Frequency in terms of Hertz
fre  = 5
#Sample rate
fre_samp = 50
t = np.linspace(0, 2, 2 * fre_samp, endpoint = False )
a = np.sin(fre  * 2 * np.pi * t)
figure, axis = plt.subplots()
axis.plot(t, a)
axis.set_xlabel ('Time (s)')
axis.set_ylabel ('Signal amplitude')
plt.show()
Output :
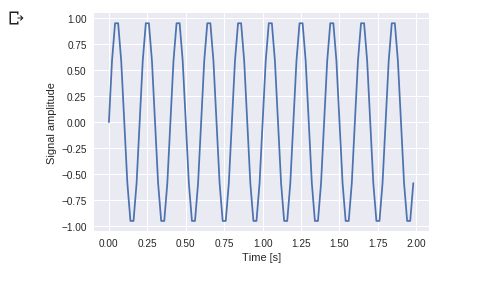
You can see this. Frequency is 5 Hz and its signal repeats in 1/5 seconds – it’s call as a particular time period.
Now let us use this sinusoid wave with the help of DFT application.
from scipy import fftpack

A = fftpack.fft(a)
frequency = fftpack.fftfreq(len(a)) * fre_samp
figure, axis = plt.subplots()

axis.stem(frequency, np.abs(A))
axis.set_xlabel('Frequency in Hz')
axis.set_ylabel('Frequency Spectrum Magnitude')
axis.set_xlim(-fre_samp / 2, fre_samp/ 2)
axis.set_ylim(-5, 110)
plt.show()
Output:
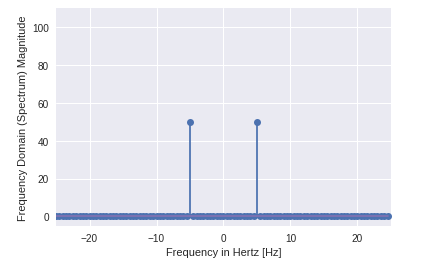
- You can clearly see that output is a one-dimensional array.
- Input containing complex values are zero except two points.
- In DFT example we visualize the magnitude of the signal.